

Last updated: Feb 22, 2020
Model Name: BCG Portfolio Matrix
Creator: Bruce Henderson- Boston Consulting Group
Year: 1970
Purpose: Product Portfolio Selection & Investment Strategy
Owning a business is nothing less than a game of chess where you’ve got to make the right move at the right time.
Some grab the cup of victory while others still wonder how they did it. A business venture is a matter of constant investments and their profitability. Those who understand the art of the right investments are the ones who take away the cup.
Products and services not only bring in money, but some may also be draining it.
Through the amount and frequency of revenues generated, it is easy to identify the profitable products. On the other hand, it is much difficult to determine the growth of the rest of the portfolio.
So, how to know which product brings money into the house and which is draining it?
To ease this stress, Bruce Henderson from Boston Consulting Group developed BCG Product Portfolio Matrix that lends a hand in long-term strategic planning. The matrix empowers companies to decide which product to invest in, which one to develop, and which to discontinue.
What actually is a BCG Matrix?
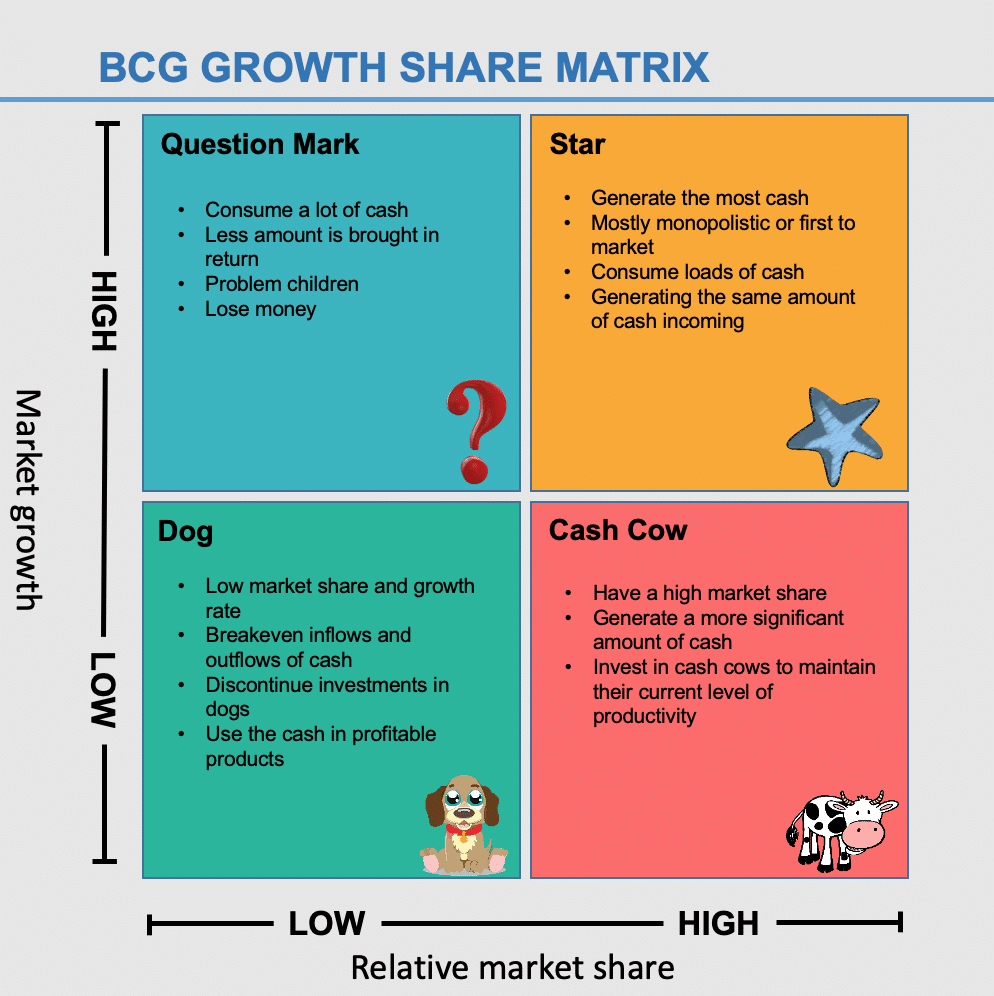
A BCG or Growth Matrix is divided into four quadrants, analyzed on the basis of Relative Market Share and Market Growth.
What is the Relative Market Share and Market Growth?
It is the brand or company’s share in the market compared to its leading competitor. This means a market share represents how much space your product holds in the market.
Market Growth is simply the number of users or buyers of a particular product or service in the market.
How does BCG Growth-Share Matrix work?
- The performance of the portfolio is analyzed based on the assumption that an increase in the relative market share results in a simultaneous increase in the generation of cash.
- Another assumption is that a growing market always requires cash investments in assets to expand the capacity which in turns results in the consumption of cash.
Thus, the whole matrix is analyzed according to its cash consumption and generation.
BCG Growth Share Matrix has been widely used by companies since 1970 to help them gain insights on the products that best help capitalize their share in the market.

Source: Business News Daily reports,
Getting started with a BCG Matrix for your Business
- First thing’s first – To create your BCG Matrix, gather the data related to the market share and growth of your products.
- Compare your position with your biggest competitor and analyze the growth in the upcoming five years.
- Draw your chart with the 4 quadrants; Question Marks, Stars, Cash Cows, and Dogs.
- Finally, place each of your product into the relevant quadrant according to their rank in market share and growth.
Breakdown of the Quadrants – BCG matrix examples
Consider Samsung, a globally renowned company operating in the electronics industry to better understand the placement of your products with BCG Growth-Share Matrix examples.
#1 – Question Marks or Problem Child – Products in High Growth Markets with Low Market Share
As the name suggests, these products are a question mark in the entire portfolio. They consume a lot of cash while very less amount is brought in return. These question marks or problem children may end up losing money.
It should be noted that these products, being in a rapidly growing market, possess the potential to become stars. If the potential for growth is high, the company should invest to develop these products or sell them otherwise.
Example of Question Marks – Galaxy 7, with a negative reputation due to overheated battery and safety concerns, is an example of the Problem Child for Samsung. The position of the specified model is weak in comparison to other models.
The company can either discontinue the product or invest to make improvements. Investment in this domain will remain highly risky as not many people will trust enough to buy a device with such a negative reputation.

# 2 – Stars – High Growth and High Market Share
The stars exist in high growth markets and generate the most cash. Such products are mostly monopolistic or first to market. As these products are in their high growth rate, they too consume loads of cash which may end up in generating the same amount of cash incoming as it is outgoing.
It is advised to invest in Stars. If these products sustain their success until market growth rate declines, the stars may eventually become cash cows.
Example of Stars – Samsung is continuously investing in its mobile phone units with increasingly advanced features and newer models.
Similarly, Smart TVs are also a Star product for the company as this product attained a large number of sales in the market globally.

# 3 – Cash Cows – Low Growth and High Market Share
Cash Cow Definition – Cash Cows are those business units or products that exist in low growth markets but have a high market share. These products generate a more significant amount of cash than consumed. It is advised to “milk” the gains, and invest in cash cows to maintain their current level of productivity.
The fast cash generated through cash cows can be utilized to cover the operational and administrative costs of the company and to turn Question Marks into Cash Cows.
Example of Cash Cows – Samsung home appliances are cash cows for the company with the relatively lesser amount of cash being invested than is harvested. With baby-steps towards small technological changes and advancement in features, the appliances continue to generate a great amount of cash for the company.

# 4 – Dogs – Low Growth and Market Share
Pets or Dogs are the products that have a low market share and growth rate. These products have breakeven inflows and outflows of cash. It is advised to discontinue investments in dogs to use the cash in profitable products.
Example of Dogs – Due to certain unattractive reasons, Galaxy Smart Watch can be taken as a Pet for Samsung. The watches did not succeed in gaining adequate attention from the target market with some evident flaws in its functionality.

Developing Strategies
Now that you have learned the position of your business units, it’s time to analyze and strategize according to the results. There can be 4 different kinds of decision-based on the BCG Matrix as discussed below:
- Build the Product – Develop the product by investing to increase its market share. Recommended for Question Marks to turn into Cash Cows.
- Hold the Product – Leaving a business unit or product for some time if you are unable to invest more into it. Usually applied in Star Products.
- Divest – Release the cash stuck where there’s no profit or discontinue the product. Best for Dogs.
- Harvest – Reducing the cash investments in a product to generate maximum cash inflow from the product. This strategy is best applied to Cash Cows which improves the overall profitability of the business.
Final Thoughts
If you’re an entrepreneur and own your own business, then you must be well aware of one of the most challenging business decisions; financial investments.
For any business venture, its products or services are the sources that keep the business going and nourished. Some products let your business survive now, and some products will keep it alive in the future.
The key lies in determining where to invest and where to divest.


Add comment