

Model Name : Strategy Canvas
Creator : W. Chan Kim and Renée Mauborgne
Year : 2005
Purpose : Current state of play | Position of a company against competitors | Blue Ocean Opportunities | Competitive Strategy |
Your company might be earning high revenues and profitability today. You are certain that it will keep growing for the next 5 years and beyond. But, what about your existing and potential competitors?
And those new entrants who offer almost similar products and services like yours in the market. What if they outperform you in the future?
Besides, you are also aware that several changes are being introduced in the ongoing business trends. Your former strategies might be not in accordance with the current state of play and the latest industry benchmarks.
How would you know your current and future position in this highly competitive and dynamic business world?
At this point, a unique visualization strategy called “Strategy Canvas” comes into play. In the book “Blue Ocean Strategy“ written by two eminent business theorists W. Chan Kim and Renée Mauborgne, this new strategy was originated.
Before moving any further with a discussion on the Strategy Canvas, we need to go over the Blue Ocean Strategy first.
What is Blue Ocean Strategy?
Blue Ocean Strategy implies that a company competing in a crowded market is always vulnerable to pitfalls and on-and-off situations.
It can never get to that place where its competitors are unreachable. In contrast, a company who has something quite unique and uncommon to offer usually leads to the uncontested market space where its competitions can never reach and ultimately, competitors become irrelevant.
The strategy emphasizes that business entities should touch on those areas in the industry which are untapped or not discovered by any other company yet. With distinctive customer value creation and cost-effective methods, companies can build their Blue Ocean again.
Let’s take the example of Apple’s iTunes. Apple noticed that there is a market space for digital music. Sharing of music files was not free or even accessible till the late 1990s.
Thus, with this entirely new market idea, Apple launched iTunes in 2003 which quickly became a huge success in the music industry. People could now easily download their favorite music for a nominal fee with this technology.
Construct your own Blue Ocean with Strategy Canvas
Now, coming back to the strategy canvas.
This strategy helps you to explore and probe the current market space to construct your own Blue Ocean where your competitors can never outreach, and your dominance will be lasting.
Main Features of Strategy Canvas
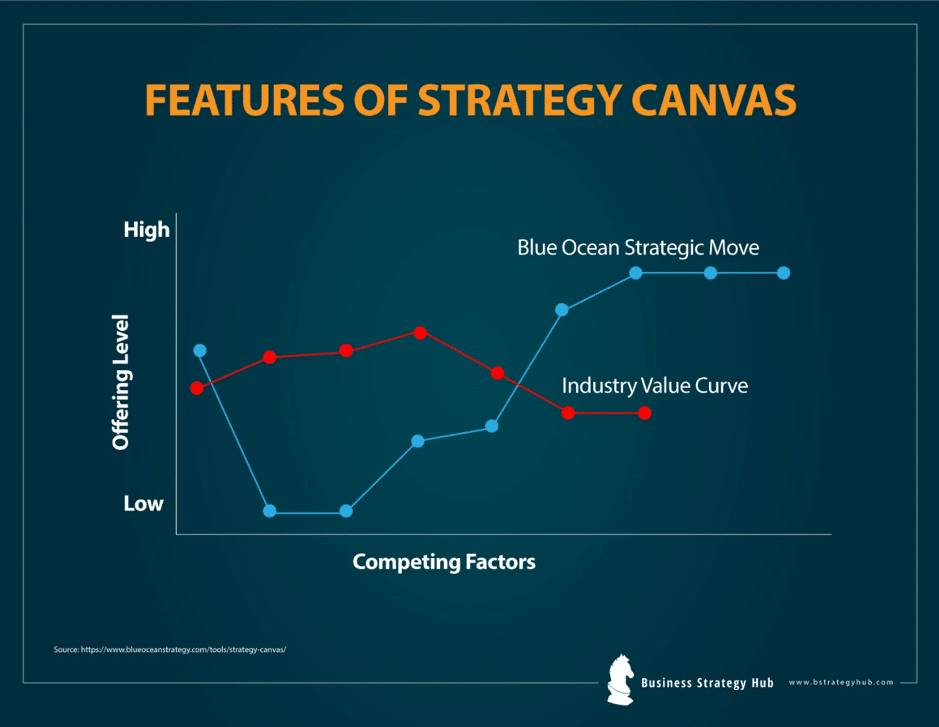
Image Source: www.blueoceanstrategy.com [Kim & Mauborgne]
Strategy canvas is basically an action framework which is represented by a line graph to pinpoint
X-axis – ‘factors of competition’
Y-axis – ‘degree of offerings’
Competing Factors are those elements in which the industry competes and invests. These factors vary according to the nature of the business.
For example, for the airline industry,
Factors of competition are :
- meals
- prices
- lounges
- hub connectivity
- friendly service
- speed etc.
For the hotel industry,
Competing Factors would be:
- room size
- furniture
- restaurants
- architecture
- price
- receptionist
- quality services.
These all factors should be plotted on a horizontal axis to highlight the current areas in which the company is currently investing and also the potential areas where it can create new customer value in the future.
On the opposite side in a vertical axis, the offering level or the degree to which a company invests in each factor, alongside its competitors’ offering is to be plotted.
These are marked as ‘High’ and ‘Low’.
The more a company invests in a specific factor, the higher a point will be marked at ‘Offering Level’ and vice-versa.
How to create Strategy Canvas graph
This graph is very easy to create. All you need to do is plot points according to your current organizational performance and your competitors’ performance.
Draw a point in those factors you are currently investing and at how much extent you make your offerings in that area to your customers.
Subsequently, connect all the points through a line that displays a value curve of your and your competitors’ companies.
What this Graph represents
This graph allows you to take innovative advantages out of it. It gives you three primary information pieces which are shown below:
- It allows you to see the current market scenario and industry benchmarks along with your competitors. Here, you will be able to answer the following:
- What is your position?
- What is your competitors’ position?
- Do your strategies differ from your competitors’ or are both of you on the same page?
- It tells you where you and your competitors’ strategies diverge:
- In which areas are you different from your competitors?
- How significant is the difference?
- It enables you to realize the empty spaces where new opportunities can be built:
- How more innovative can you become?
- What new competitive differentiation can you bring?
- How can you reach untapped areas where no competitor has gone so far?
- How can you target more customers?
Thus, with this depiction, you will be able to understand where your company is heading to and how can you improve those areas where you see lacking.
Besides, you can focus on developing your Unique Selling Proposition (USP) which is offered by no one. You can also create a niche market where no or only a few companies exist.
Example of Strategy Canvas
How Southwest Airlines differentiated their Strategy through Strategy Canvas
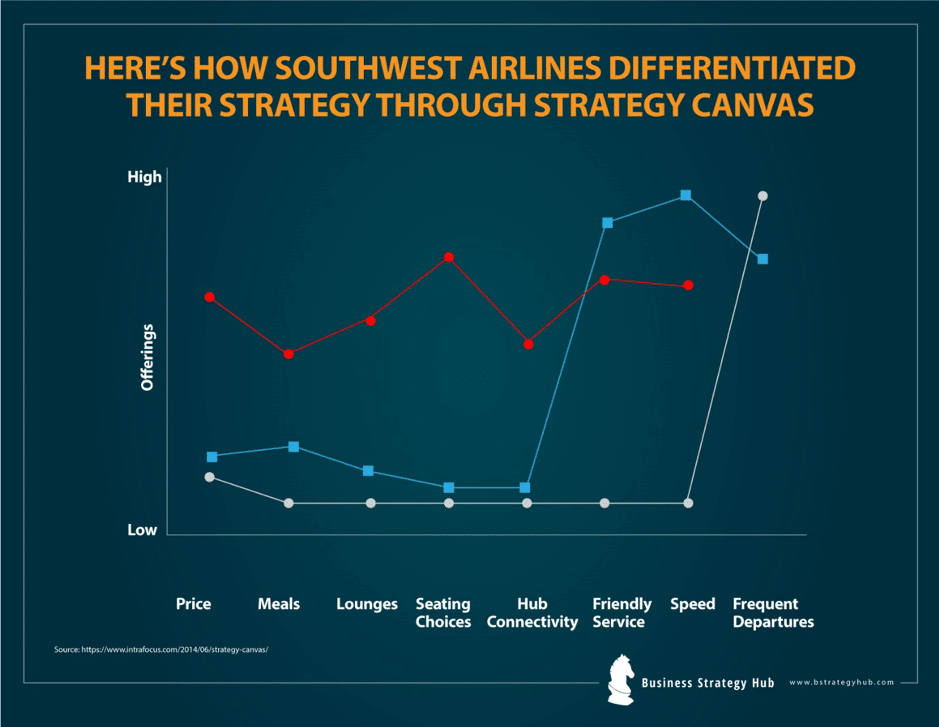
Image Source: www.intrafocus.com
Southwest Airlines knew that prices, meals, seating choices, and hub connectivity are those general areas where every company is investing and doing well. Although these are the common benchmarks, ‘frequent departures’ is the factor which is untapped and can be made as a competitive strategy.
Besides, some customers travel frequently.
Thus, Southwest Airlines reduced the costs on meals, hub connectivity and other general factors and invested mostly on its frequent departure factor along with friendly services and speed.
Eventually, the prices decreased, and customers started to prefer Southwest Airlines due to low prices over others.
The grey line in the above chart portrays Southwest Airlines. You can see that the factor of frequent departure is placed at a high offering.
This factor was not thought by any other airline company before. By providing frequent departures for a few routes supplied by Airlines, the company made a Blue Ocean move and earned an amazing differentiated and unreachable position.
So now, with strategy canvas, you can tell how long you will sustain in the market!
References & more information
- www.blueoceanstrategy.com
- https://www.intrafocus.com/2014/06/strategy-canvas/


Add comment