

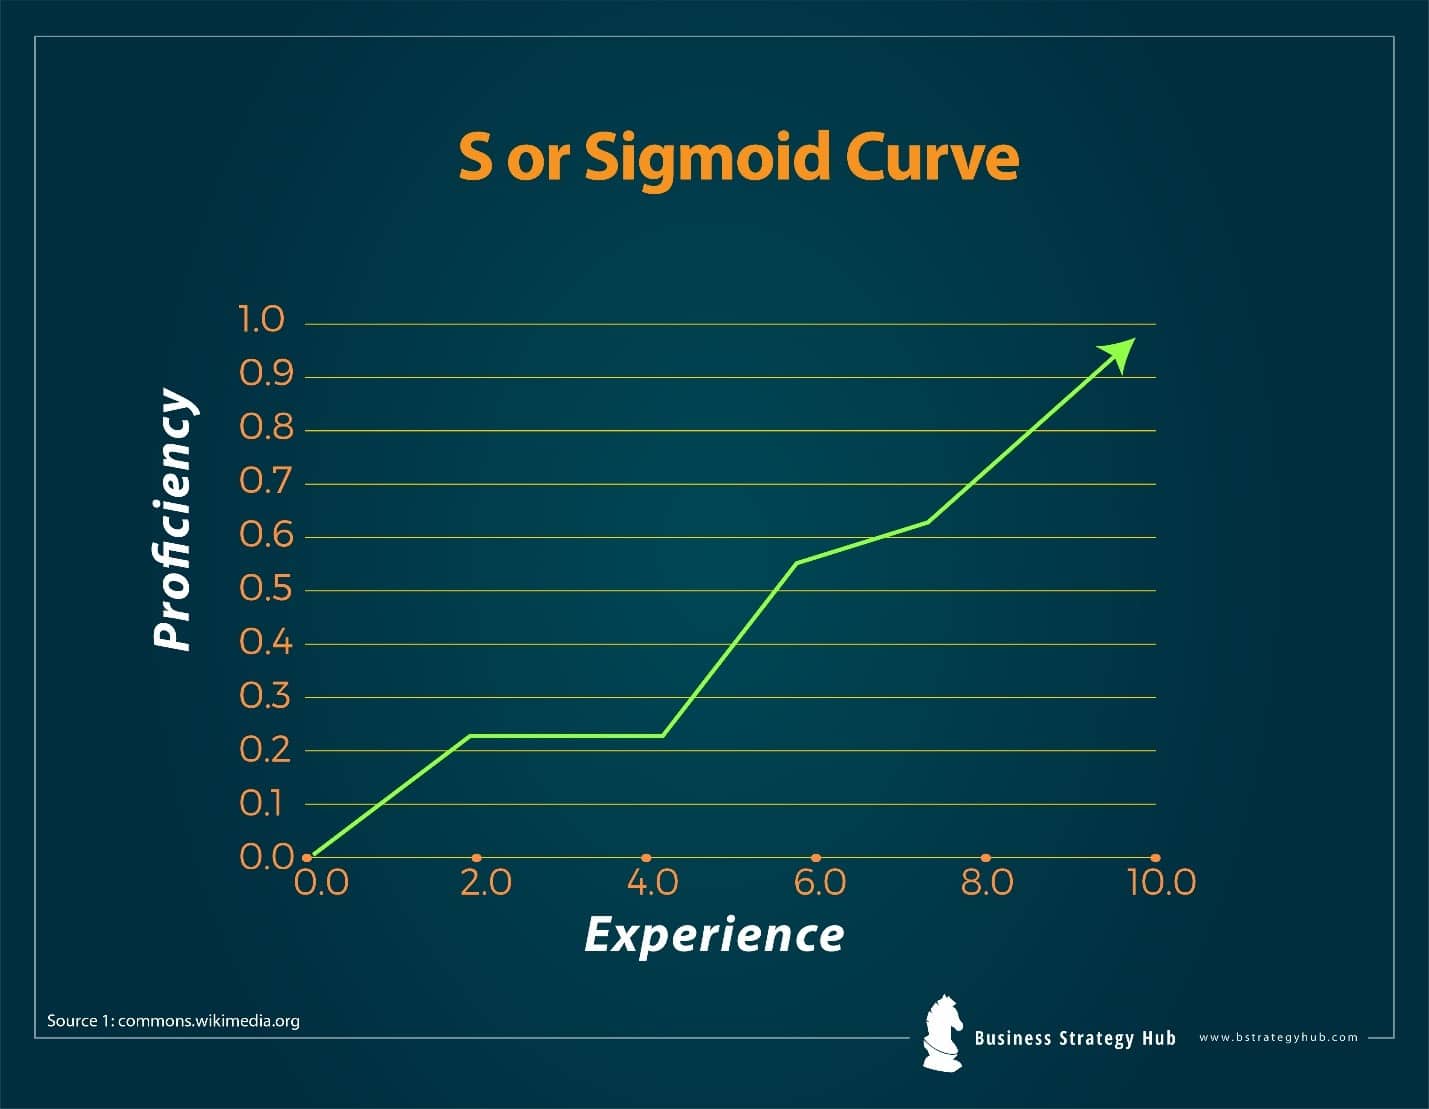
Model Name : Sigmoid Curve (s-curve)
Author: Pierre Francois Verhulst
Year: 1838
Purpose: Measuring growth, creative problem solving, innovation, technology forecast, project management, strategy planning, logistic solutions, determining progress, analyzing variables, monitoring performance.
As a business person, you must be constantly wondering how leading global companies and project managers measure growth and track progress.
A project’s implementation and successful completion depends immensely on the organization’s ability to determine its progress and monitor the various variables that are at play.
Setting the targets for your project may seem easy in theory. But practically speaking, without a definite approach and adequate performance tracking, minute problems and errors can quickly turn into big issues causing a massive decline in business growth.
Naturally when you are running a company that constitutes a number of employees with multiple projects operating at once, keeping track of progress and management becomes difficult.
Efficient planners and smart growth managers know full well when to strike and reinvent themselves and their business sporadically. They expand their sphere and take into account all the resources they have to recreate their potential. In essence, they opt for the most effective logistic tool, the S-Curve.
But what does an S-Curve do?
The S-Curve enables leaders to track a project’s pace and foresee the possible risks that could emerge, allowing them to fix what is not yet out of order. It earns them the advantage to stay a step ahead and combat the obstacles that may hinder their progress.
Understanding the S Curve model
A proper understanding of the S-Curve model will help you and your fellow entrepreneurs comprehend the importance of tracking the pace and growth of a project at every level.
Moving beyond the technical definition, it could be simply put that the S-Curve demonstrates the supply-demand relationship and profit rate in a fast-paced market.
The S-Curve makes use of the estimated working hours and resources to efficiently complete a project alongside the actual working hours and resources available in a fixed time frame.
The curvature in the model thus shows a simultaneous comparison of the actual time and cost alongside the estimated time and cost.
Is it important though?
Yes. As you will step deeper into the corporate world, you will notice how project managers and strategists implement S-Curves in most assessment reports and project timelines. That is because it is a tracking tool which graphically depicts comparisons of different S-Curves beside the standard S-Curve to distinctly mark the growth or progress of any project.
The statistics are simultaneously plotted in the form of a graph that represents how efficiently the team has performed and utilized the time and allotted budget.
The question, however, remains: how do S-Curves benefit an organization?
There are many ways in which S-Curves can be effective in fulfilling project management purposes. Some of these ways include:
1. Resource Management
The S-Curve can help represent utilization and consumption of resources over the given time frame.
- Man hours v. Time S-Curve – This depicts the given labor and time utilized over the course of the project. The graph thus allows the company to adjust manpower and time in order to keep the project on track.
- Budget v. Time S-Curve – This enables the company to track the cumulative cost conserved over the course of the project. It comes handy in forecasting the project’s cash flow and the total cost for completion.
2. Progress Evaluation
While initiating a project, some objectives are laid down for drafting the estimated resource consumption, labor, time frame, and total cost. It is known as a planned or baseline S-Curve.
Once the project has commenced, the planned outline is revised in relation to the actual progress. This changed plan which ideally should be in accordance with the baseline schedule is known as target S-Curve.
The production schedule during the project changes rapidly due to practical circumstances and an actual rate of completion for each task in the project. It is known as the actual S-Curve which exhibits the real pace at which the project is working.
By simultaneously drawing the data from these curves, you can instantly get a picture of your project’s current status on the S-Curve. It also enables you to judge your team’s performance and take steps to effectively monitor progress.
3. Establishing Product Maturity
Where the S-Curve helps determine performance in reference to labor/resources and time, it also enables the company to measure its product’s maturity.
Confused?
Let me explain.
When a product is just making its way in the market, the profit is at maximum. However once the product becomes common, the profit rate declines. That’s why it is prudent to prioritize growth and innovation. An S-Curve model benefits the investors to anticipate growth and establish a premium price for their product. Because once the product matures, it remains consistently profitable in the market.
Limitations and going beyond them
When we speak of growth, we speak in mathematical terms – graphs, flowcharts, statistical diagrams. Even though these are essential tools, what is more important is the practical execution to maintain progress.
Growth persists through a calculative mindset, not figures. The S-Curve stands as a focus in strategy planning, yet the model has certain limitations:
- It does not suggest precautions in the case of market disturbance or discontinuity.
- It does not indicate the magnitude of profit/loss from new initiatives.
- It does not suggest when to invest in new products and do away with old ones.
- The model is an estimation of the path the project may follow. The practical and on-ground structure of the project can vary.
In summary, the S-Curve model facilitates growth; however, it does not do much to sustain the momentum in the market.
But do these limitations diminish the efficacy of S-Curves?
Absolutely not!
The key is going beyond the figures and making use of S-Curves qualitatively to gain insights and thorough understandings.
Remember Agfa? Compaq? Blackberry? MSN? These were some companies that once were all over the market but are no more around. Why? What did they lack?
They stopped growing, yes! Still growth alone wasn’t a problem, holding the market through inventive planning was.
The market is ever-changing, and once-exquisite products tend to lose appeal impacting growth—almost every company! But what distinguishes successful companies from the ones gone in a slump is how they handle it.
More than a framework
The S-Curve is an effective framework that can be used to evaluate the growth and progress of companies at their different levels and to justify their successes and failures.
However, keeping the S-Curve of business going is only possible when the firm is designed to adapt and innovate, and has passion-driven leaders.
References & more information
- http://www.maxwideman.com/guests/s-curve/using.htm
- https://hbr.org/2011/01/reinvent-your-business-before-its-too-late
- http://studylib.net/doc/6895362/limitations-of-s-curve-model-as-a-prescriptive-tool
Tell us what you think? Did you find this article interesting?
Share your thoughts and experiences in the comments section below.


Add comment